Guide to using conduit
18 February 2015
The openapi project is an attempt to make it easier to connect people with data. The openapi architecture uses an XML scheme to describe modules of discrete data analaysis and exploration steps, which can be arranged in pipelines to describe data workflows. Both modules and pipelines can be shared, modified, and rearranged to suit the user's requirements. Modules and pipelines are exected in an openapi glue system. conduit is a prototype glue system which has been written as a package for the R programming environment. More information on the openapi project can be found in the University of Auckland Department of Statistics technical report, Introducing OpenAPI.
Quick start: running a pipeline
Installing conduit
conduit is an R package built using R version 3.1.x on a 64-bit Linux machine. It requires the following R packages: XML, graph, RBGL, and RCurl. The devtools is required to install conduit directly from github. The Rgraphviz and gridGraphviz packages are required to run the modules in this quick start example.
Version 0.1-1 of the conduit, built 2015-02-08, is available for download.
Source code for conduit is available at https://github.com/anhinton/conduit for those who would like to build and install the package manually.
To install conduit using devtools:
install.packages("devtools")
devtools::install_github("anhinton/conduit")
Load the conduit package:
library(conduit)Reading a pipeline from an XML file
The loadPipeline() function is used to read a pipeline XML file into conduit. loadPipeline() requires a name argument, and a ref argument which describes the XML file location The function returns a pipeline object.
We will load a pipeline which creates and plots a simple node-and-edge graph. oThe pipeline XML file is in a sub-directory of the R working directory called 'simpleGraph'.
## load the simpleGraph pipeline
simpleGraph <-
    loadPipeline(name = "simpleGraph",
                 ref = normalizePath(file.path("simpleGraph", "pipeline.xml")))
According to its description:
This pipeline creates a directed graphNEL graph, lays it out using the Rgraphviz package, and then plots the graph as a PNG file using the gridGraphviz packageRun a pipeline in conduit
The runPipeline() function is used to run a pipeline object in R. It requires a pipeline object as its only argument. This function will create a directory for the pipeline in the 'pipelines' sub-directory of the current working directory. If a 'pipelines' sub-directory does not exist it will be created. Each module in the pipeline will create output in a named directory found in ./pipelines/PIPELINE_NAME/modules.
## run the simpleGraph pipeline
validatePipeline(simpleGraph)
## [1] TRUEconduit:::graphPipeline(simpleGraph)## A graphNEL graph with directed edges
## Number of Nodes = 3
## Number of Edges = 2runPipeline(simpleGraph)This creates the following files:
- pipelines/simpleGraph/modules/createGraph/directedGraph.rds
- pipelines/simpleGraph/modules/createGraph/script.R
- pipelines/simpleGraph/modules/layoutGraph/Ragraph.rds
- pipelines/simpleGraph/modules/layoutGraph/script.R
- pipelines/simpleGraph/modules/plotGraph/example.png
- pipelines/simpleGraph/modules/plotGraph/script.R
File number 5, pipelines/simpleGraph/modules/plotGraph/example.png is the output file we require, the PNG image of the graph. The image is shown below:
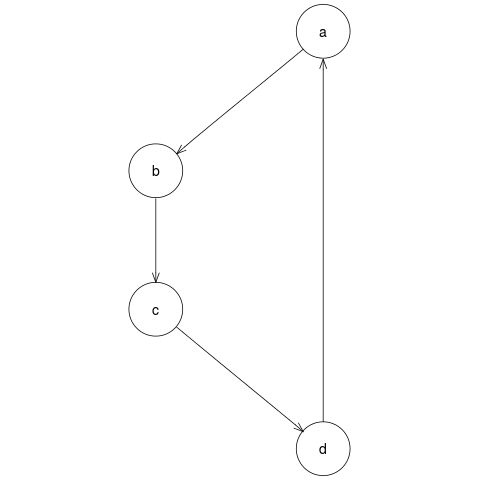
Pipeline output: PNG image file of graph
The remainder of this document goes into greater detail about how to create execute openapi modules and pipelines using conduit. Following these is a discussion on how to search for files in conduit, and about the outputs produced by conduit. To finish there are two fully worked examples: how to create a pipeline containing modules with R script files for sources, and how to create a pipeline which uses both R scripts and python scripts.
Modules
This sections describes how to: load modules from XML files; create modules; execute module source scripts; save modules as module XML files.
Loading modules from XML
loadModule()
This function reads and interprets a module XML file, producing a module object in R. It requires the following arguments:
name: module name (must be unique within a pipeline)ref: Filename or file path of xml file.path: optional search path(s) forrefresource
loadModule() also accepts a namespaces argument, which should be a named character vector of namespaces used in the module XML file. The default value for namespaces is c(oa = "http://www.openapi.org/2014/")).
Example:
plotGraphXML <- file.path("simpleGraph", "plotGraph.xml")
plotGraph <- loadModule(name = "plotGraph",
                        ref = plotGraphXML)
Creating modules
Modules can be created in conduit using the module() function and its associated helper functions. The resulting modules can be executed in conduit, or saved to disk as module XML files.
The following example shows how a module can be created.
## create input, output, and source lists
inputsList <-
    list(moduleInput("myGraph", "internal", "R \"graphNEL\" object"))
outputsList <-
    list(moduleOutput("Ragraph", "internal", "R \"Ragraph\" object"))
sourcesList <-
    list(moduleSource(value = c("library(Rgraphviz)",
                                "Ragraph <- agopen(myGraph, \"myGraph\")")))
## create module
layoutGraph <- module(name = "layoutGraph", platform = "R",
                      description = "Lays out a graphNEL graph using the Rgraphviz package",
                      inputs = inputsList,
                      outputs = outputsList,
                      sources = sourcesList)
module()
The module() function is used to create module objects.
Required aruments:
name: module name (must be unique within a pipeline)platform: name of platform required to execute module source
Optional arguments:
description: a brief description of what the module doesinputs: a list ofmoduleInputobjectsoutputs: a list ofmoduleOutputobjectssources: a list ofmoduleSourceobjects
Examples:
mod1 <- module(name = "cleanCSV", platform = "R",
               description = "clean up the data in a CSV file",
               inputs = inputsList1, outputs = outputsList1,
               sources = sourcesList1)
moduleInput()
The moduleInput() function is used to create the inputs for modules created in R with the module() function. Each input should correspond to an object of the same name in the module's source(s). It requires the following arguments:
name: input name (must be unique within a module)type: "internal" or "external"
Optional arguments:
format: format of input for validation, e.g. "R data frame"formatType: type of object given to be used for validation. Defaults to "text" to perform text-matching offormats.
Examples:
inp1 <- moduleInput(name = "pollingBooths", type = "internal",
                    format = "R data frame")
inp2 <- moduleInput(name = "boothLatLong", type = "external",
                    format = "CSV file", formatType = "text")
moduleOutput()
The moduleOutput() function is used to create the outputs for modules created in R with the module() function. Each "internal" output should correspond to an object of the same name in the module's source(s). "external" outputs are not produced by conduit, but are produced directly by the module source script(s). It is recommended that an "external" output have the same name and ref, though this is not compulsory. moduleOutput() requires the following arguments:
name: output name (must be unique within a module)type: "internal" or "external"ref: if the outputtypeis "external" arefmust be provided. This provides the file location of the external output produced by the module source(s). This should be either a filename if the source(s) produce the file in the working direcory, or the full resource location of the external file. Relative file paths should not be used.
Optional arguments:
format: format of input for validation, e.g. "R data frame"formatType: type of object given to be used for validation. Defaults to "text" to perform text-matching offormats.
Examples:
outp1 <- moduleOutput(name = "pollingBooths", type = "internal",
                      format = "R data frame")
outp2 <- moduleOutput(name = "boothCoords.csv", type = "external",
                      format = "CSV file", ref = "boothCoords.csv")
moduleSource()
The moduleSource() function creates source objects. These objects contain the scripts which are to be executed using a module's platform.
A source script can either be provided inline as a character vector, or as a reference to a script file.
Arguments:
value: a character vector containing the script to be executed. Ifvalueargument is empty, and arefis provided, script will be read from the resource provided inref.ref: Filename or file location of a text script file.path: optional search path(s) forrefresource
type: not used as at 2015-01-07.order: numeric value specifying the position of execution of this source in the module's sources. Module sources are executed in the following order:- negative numbers in ascending order
- 0 (zero)
- no order specified
- positive numbers in ascending order
Examples:
script1 <- "pollingPlaces <- read.csv(file = csv_input)"
source1 <- moduleSource(value = script1)
source2 <- moduleSource(ref = "plotting.R", path = "~/handyScripts",
                        order = "-1")
Executing module scripts
runModule()
Module source scripts are executed using the runModule() function. The function makes the module's inputs available to the source script(s) in the designated platform, and executes the source script(s). The module's outputs are saved to a directory called modules, in a subdirectory with the module's name. This function requires the following arguments:
module: a module object, usually frommodule()orloadModule()inputs: a named list of absolute locations of module's inputstargetDirectory: file path formodulesoutput directory
Examples:
## run a module with no inputs
createGraphXML <- file.path("simpleGraph", "createGraph.xml")
createGraph <- loadModule(name = "createGraph", ref = createGraphXML)
runModule(module = createGraph, targetDirectory = getwd())
The module's output can be found at:
## run a module with an input
layoutGraphXML <- file.path("simpleGraph", "layoutGraph.xml")
layoutGraph <- loadModule("layoutGraph", layoutGraphXML)
## this module uses the output from the previous module as input
myGraph <- file.path("modules", "createGraph", "directedGraph.rds")
runModule(module = layoutGraph,
          inputs = c(myGraph = normalizePath(myGraph)))
Saving modules as XML files
saveModule()
This function saves a module to disk as a module XML file. This function requires a module object be passed to the module argument. The function also accepts the following optional arguments:
targetDirectory: location to save XML file. This defaults to the current working directory.filename: name of resulting XML file. If not specified the file will be given themodulename with '.xml' appended.
The full path of the resulting file is returned.
Examples:
Specify the filename for the new module XML file:
createGraph <- loadModule("createGraph",
                          file.path("simpleGraph", "createGraph.xml"))
tempTarget <- tempdir()
saveModule(module = createGraph, targetDirectory = tempTarget,
           filename = "newCreateGraph.xml")
## [1] "/tmp/RtmpnXBEa8/newCreateGraph.xml"Save a module to XML without specifiying the filename:
layoutGraph <- loadModule("layoutGraph",
                          file.path("simpleGraph", "layoutGraph.xml"))
layoutGraph$name
## [1] "layoutGraph"saveModule(module = layoutGraph, targetDirectory = tempTarget)## [1] "/tmp/RtmpnXBEa8/layoutGraph.xml"Pipelines
This sections describes how to: load pipelines from XML files; create pipelines ; execute pipeline components; save pipelines and their components as XML files.
Loading pipelines from XML
loadPipeline()
This function reads and interprets a pipeline XML file, producing a pipeline object in R. The function will also read and interpret module and pipeline XML provided in the XML's file <component> nodes. The resulting objects will be loaded into the components slot of the parent pipeline object. loadPipeline() requires the following arguments:
name: pipeline nameref: Filename or file path of XML file.path: optional search path(s) forrefresource
loadPipeline() also accepts a namespaces argument, which should be a named character vector of namespaces used in the pipeline XML file. The default value for namespaces is c(oa = "http://www.openapi.org/2014/")).
Example:
simpleGraph <- loadPipeline(name = "simpleGraph",
                            ref = normalizePath(
                                file.path("simpleGraph", "pipeline.xml")))
Creating pipelines
Pipelines can be created using the pipeline() function, and its associated helper functions. The resulting pipeline objects can be executed using conduit, or saved to disk as XML files.
pipeline()
The pipeline function requires a name argument. The following arguments can also be provided:
description: A text description of what the pipeline does.components: a list of the pipelines components. These must bemoduleorpipelineobjects (or both). If this argument is empty the pipeline's components will be taken from the following arguments:modules: a list ofmoduleobjects.pipelines: a list ofpipelineobjects.
pipes: a list ofpipeobjects.
Example:
createGraph <- loadModule("createGraph",
                          file.path("simpleGraph", "createGraph.xml"))
layoutGraph <- loadModule("layoutGraph",
                          file.path("simpleGraph", "layoutGraph.xml"))
pipe1 <- pipe("createGraph", "directedGraph", "layoutGraph", "myGraph")
pipelineExample <-
    pipeline(name = "example",
             components = list(createGraph, layoutGraph),
             pipes = list(pipe1))
addComponent()
addComponent can be used to add a module or pipeline to the components of a pipeline created created with pipeline() or loadPipeline().
Arguments:
newComponent:moduleorpipelineobject to be added.pipeline: pipeline to be amended.
Example:
testPipeline <- pipeline("test")
plotGraph <- loadModule("plotGraph",
                        file.path("simpleGraph", "plotGraph.xml"))
testPipeline <- addComponent(plotGraph, testPipeline)
pipe()
This function creates a pipe object, which connects the output of one pipeline component to the input of another pipeline component. The function requirtes four character vectors as arguments:
startComponent: name of the start component.startOutput: name of the required start component output.endComponent: name of the end component.endInput: name of the requrired end component input.
Example:
pipe1 <- pipe(startComponent = "createGraph", startOutput = "myGraph",
              endComponent = "layoutGraph", endInput = "directedGraph")
addPipe()
addPipe() can be used to add a new pipe to an existing pipeline object.
Arguments:
newPipe: newpipeobject.pipeleine: existingpipelineobject.
Example:
createGraph <- loadModule("createGraph",
                          file.path("simpleGraph", "createGraph.xml"))
layoutGraph <- loadModule("layoutGraph",
                          file.path("simpleGraph", "layoutGraph.xml"))
pipelineExample <-
    pipeline(name = "example",
             components = list(createGraph, layoutGraph))
## create new pipe
pipe1 <- pipe("createGraph", "directedGraph", "layoutGraph", "myGraph")
## add pipe to pipeline
pipelineExample <- addPipe(pipe1, pipelineExample)
Executing pipeline components
runPipeline()
Pipeline can be executed using the runPipeline() function. The pipeline's components will be executed in an order which ensures each component's inputs will be satisfied. This function creates a directory called 'pipelines' in the current working directory. The output from a pipeline's components are saved in this diretory, in a sub-directory named after the pipeline.
This function has one argument, pipeline, which must be a pipeline object created using pipeline() or loadPipeline().
Example:
simpleGraph <- loadPipeline("simpleGraph",
                            file.path("simpleGraph", "pipeline.xml"))
runPipeline(simpleGraph)
runComponent()
Individual components in a pipeline can be executed using the runComponent() function. This can be useful for testing a pipeline. This function requires two arguments:
componentName: Name of component to be executed.pipeline:pipelinecontaining component.
If the component is a module with one or more inputs, these massed be provided as a named list to the inputs argument.
runComponent() will place component output in either a 'modules' or 'pipelines' directory, depending on the type of component. The location of this output directory can be specified using the pipelinePath argument.
Examples:
Running a component with no inputs:
simpleGraph <-
    loadPipeline("simpleGraph",
                 normalizePath(file.path("simpleGraph", "pipeline.xml")))
names(simpleGraph$components)
## [1] "plotGraph" "createGraph" "layoutGraph"runComponent(componentName = "createGraph", pipeline = simpleGraph)## [1] 0The component's output can be found at:
Running a component with one input:
simpleGraph <-
    loadPipeline("simpleGraph",
                 normalizePath(file.path("simpleGraph", "pipeline.xml")))
runComponent("layoutGraph", simpleGraph,
             inputs =
                 list(myGraph =
                          normalizePath(
                              file.path("modules", "createGraph",
                                        "directedGraph.rds"))))
## [1] 0The component's output can be found at:
Saving and exporting pipelines as XML files
Pipelines created using can pipeline() and loadPipeline() can be saved to disk as XML files using the savePipeline() and exportPipeline() functions. savePipeline() will produce a single XML representing the pipeline; exportPipeline() will also create an XML file for each of the pipeline's components.
savePipeline()
A pipeline can be saved to an XML file using savePipeline(). The pipeline argument must be provided with a pipeline object. The resulting xml file is always called pipeline.xml. The location of this file can be set using the targetDirectory argument.
Example:
simpleGraph <-
    loadPipeline("simpleGraph",
                 normalizePath(file.path("simpleGraph", "pipeline.xml")))
savePipeline(pipeline = simpleGraph, targetDirectory = "savePipeline")
## [1] "savePipeline/pipeline.xml"The resulting XML file can be found at:
exportPipeline()
exportPipeline() will save a pipeline to XML file, and save all its components to XML files, also. All the pipelines components will be given as references to the XML files created.
This function will save the XML files to a directory with pipeline's name, in the location specified in the argument targetDirectory.
Example:
simpleGraph <-
    loadPipeline("graphExport",
                 normalizePath(file.path("simpleGraph", "pipeline.xml")))
exportPipeline(pipeline = simpleGraph, targetDirectory = "exportPipeline")
## $pipeline
## [1] "exportPipeline/graphExport/pipeline.xml"
##
## $plotGraph
## [1] "exportPipeline/graphExport/plotGraph.xml"
##
## $createGraph
## [1] "exportPipeline/graphExport/createGraph.xml"
##
## $layoutGraph
## [1] "exportPipeline/graphExport/layoutGraph.xml"The resulting XML files can be found at:
Searching for files in conduit
conduit allows the user to either specify the location of a resource file, or to provide a filename and file location(s) where the file should be found. Functions which have ref and path arguments provide the option to search for a resource.
If the value of ref is an absolute resource address, e.g. a full file path, then no further searching will be done. Relative file paths can also be provided to ref arguments. TODO: provide precise definition explaining to which location a relative ref is relative.
If no resource can be sensibly found at ref, a search is started. Conduit will search by default in the directory for the module or pipeline which initiated the search, then R's current working directory. The default search paths can be amended or replaced by the path argument. Search paths are given as character strings, with each path divided by the '|' character. Values for path which end in '|' will be prepended to the default search paths, and those which beging with '|' will be appended.
conduit will search in each search path provided until a matching file is located. The first match will be returned.
The following example will attemp to load a module by searching for a file named in ref in the paths listed in path, and then the default search paths.
mod1 <- loadModule(name = "loader", ref = "arrangeLines.xml",
                   path = "~/openapi|/media/ashley/floppyDisk|")
Outputs in conduit
When a module's source code is executed in conduit by the runModule() function, the module's outputs are saved to disk in a directory with the same name as the module.
Internal outputs are saved to disk by serializing objects in a file format relevant to the platform used. For example, imagine a module source script for the "R" platform creates an object, finalData.df. To mark this object as a module output the module must contain an internal output, named "finalData.df". When the module's source script is executed conduit will produce a file named "finalData.df.rds" in the module's output directory; the file extension ".rds" is used for serializing R objects. Similarly, internal outputs from source scripts for the "python" platform will be serialized to a file with the file extension ".pickle".
External outputs should be easy to identify, as they will be explicitly named in the module's source script.
Example: creating a pipeline from R scripts
In this example I will demonstrate how a pipeline can be created using R scripts for the modules' source scripts. We will create a pipeline called "aucklandRents" which reads in prices of flat listings for various Auckland suburbs and creates a boxplot comparison of three of those suburbs. Our first two modules will be 'dummy' modules, which load CSV files into conduit; one CSV file contains rental prices indexed by suburb, and the other contains a key for the suburb indices. The next module uses the suburb key to name the suburbs in the price listings, and produces an R data frame of this. This R data frame is cropped to the suburbs of interest in the next module, then the final module produces a boxplot of the rental prices for each suburb remaining.
TODO: make mention of packages used
R scripts
The R scripts for our example are as follows:
## rentalListings <- read.csv(rentalListings.csv, header = TRUE)
## suburbIDs <- read.csv(suburbIDs.csv, header = TRUE, stringsAsFactors = FALSE)
##
## namedListings <- merge(x = rentalListings, y = suburbIDs,
## by.x = "suburb", by.y = "subIDs")## ofInterest <-
## namedListings$subNames %in% c("Kingsland", "Grey Lynn", "Ponsonby")
##
## shortListings <- namedListings[ofInterest,]
## shortListings$subNames <- factor(shortListings$subNames)## svg("boxplot-rentBySuburb.svg")
## boxplot(listings$rent ~ listings$subNames, xlab = "Suburb",
## ylab = "Rent per week ($)", main="Rental prices in Auckland")
## dev.off()R users will notice that the first script calls for files rentalListings.csv and suburbIDs.csv but that no such objects have been created. These object will be named as an inputs for this module, and will be made available to the module's R script by the glue system. Similarly the data frame namedListings will be named as an input for the second module, and listings as an input for the last module.
Getting data into conduit: rentalListings and suburbIDs
This module needs to read data from two CSV files, rentalListings.csv and suburbIDs.csv. For each CSV file we will create a dummy module which provides the file as an external output.
The rentalListings module will have one output, our first CSV file. External outputs for dummy modules require an absolute file path for ref:
rentalListingsOutput <-
    moduleOutput(name = "rentalListings.csv", type = "external",
                 format = "CSV file",
                 ref = normalizePath(file.path("aucklandRents", "data",
                                               "rentalListings.csv")))
We then create the rentalListings module as follows:
rentalListings <-
    module(name = "rentalListings", platform = "R",
           description = "load rentalListings.csv into session",
           outputs = list(rentalListingsOutput))
The suburbIDs module is created similarly:
suburbIDs <-
    module("suburbIDs", "R", "load suburbIDs.csv into session",
           outputs = list(
               moduleOutput("suburbIDs.csv", "external", "CSV file",
                            ref = normalizePath(
                                file.path("aucklandRents", "data",
                                          "suburbIDs.csv")))))
Feeding inputs to a module: nameSuburbs
As mentioned above, our next module requires two CSV files "suburbIDs.csv" and "rentalListings.csv". We will create two external inputs with these name which conduit will use to provide the module with its required inputs:
nameSuburbsInputs <- list(
    moduleInput(name = "rentalListings.csv", type = "external",
                format = "CSV file"),
    moduleInput("suburbIDs.csv", "external", "CSV file"))
This module also has one source script, from the file nameSuburbs.R:
nameSuburbsSource <- moduleSource(ref = file.path("aucklandRents", "src",
                                                  "nameSuburbs.R"))
The source script creates an 'R data frame' object, namedListings, which we will name as an internal output:
nameSuburbsOutput <-
    moduleOutput("namedListings", "internal", "R data frame")
Now we can create a module object, nameSuburbs, with the name "nameSuburbs", a description, and the inputs, source and output created above:
nameSuburbs <-
    module(name = "nameSuburbs", platform = "R",
           description = "name suburbs in rentalListings.csv using key in suburbIDs.csv",
           inputs = nameSuburbsInputs,
           sources = list(nameSuburbsSource),
           outputs = list(nameSuburbsOutput))
The chooseSuburbs module
This module has one input, an 'R data frame' namedListings, and one source from the file chooseSuburbs.R. This source produce an 'R data frame' shortListings, a smaller data frame of rental listings from three specific suburbs. We will name shortListings as an internal output:
chooseSuburbs <-
    module(name = "chooseSuburbs", platform = "R",
           description = "produces a data frame of rent prices for the named suburbs",
           inputs = list(
               moduleInput("namedListings", "internal", "R data frame")),
           sources = list(
               moduleSource(ref = file.path("aucklandRents", "src",
                                            "chooseSuburbs.R"))),
           outputs = list(
               moduleOutput("shortListings", "internal", "R data frame")))
The last module: boxplotBySuburb
The final script creates an SVG file, named "boxplot-rentBySuburb.svg", in the current working directory. We will create an external output for this module, named "boxplot-rentBySuburb.svg", and record the filename as the output's ref:
boxplotBySuburbOutput <-
    moduleOutput(name = "boxplot-rentBySuburb.svg",
                 type = "external",
                 ref = "boxplot-rentBySuburb.svg",
                 format = "SVG image file")
This module has one source script, from the file boxplotBySuburb.R. This script requires an "R data frame" object, listings. We create the module boxplotBySuburb with the following code:
boxplotBySuburb <-
    module("boxplotBySuburb", platform="R",
           inputs=list(
               moduleInput("listings", "internal", "R data frame")),
           sources=list(
               moduleSource(
                   ref=file.path("aucklandRents", "src",
                                 "boxplotBySuburb.R"))),
           outputs=list(boxplotBySuburbOutput))
Creating pipes
A pipeline consists of a set of components, and a set of pipes describing how component outputs are connected to other component inputs. The modules created above are our components; we will now create our pipes.
The dummy module rentalListings has an external output "rentalListings.csv", a "CSV file". We would like our pipeline to pas this output to the nameSuburbs module, which requires the "CSV file" external input "rentalListings.csv"`. The following code generates a pipe which makes this connection:
pipe1 <- pipe("rentalListings", "rentalListings.csv",
              "nameSuburbs", "rentalListings.csv")
Similarly, we need a pipe connecting "suburbIDs.csv" from suburbIDs to "suburbIDs.csv" in nameSuburbs:
pipe2 <- pipe("suburbIDs", "suburbIDs.csv",
              "nameSuburbs", "suburbIDs.csv")
Two more pipes are required, connecting "namedListings" from nameSuburbs to "namedListings" in chooseSuburbs, and connecting "shortListings" from chooseSuburbs to "listings" in boxplotBySuburbs.
pipe3 <- pipe("nameSuburbs", "namedListings",
              "chooseSuburbs", "namedListings")
pipe4 <- pipe("chooseSuburbs", "shortListings",
              "boxplotBySuburb", "listings")
Creating the aucklandRents pipeline
We now have all the necessary pieces to create our aucklandRents pipeline. We have our list of components:
componentsList <- list(rentalListings, suburbIDs, nameSuburbs,
                       chooseSuburbs, boxplotBySuburb)
and our list of pipes:
pipesList <- list(pipe1, pipe2, pipe3, pipe4)The following code creates our pipeline object:
aucklandRents <- pipeline(name = "aucklandRents",
                          description = "",
                          components = componentsList,
                          pipes = pipesList)
Running the aucklandRents pipeline
Now we can run our pipeline:
runPipeline(aucklandRents)This creates the following files:
- pipelines/aucklandRents/modules/boxplotBySuburb/boxplot-rentBySuburb.svg
- pipelines/aucklandRents/modules/boxplotBySuburb/script.R
- pipelines/aucklandRents/modules/chooseSuburbs/script.R
- pipelines/aucklandRents/modules/chooseSuburbs/shortListings.rds
- pipelines/aucklandRents/modules/nameSuburbs/namedListings.rds
- pipelines/aucklandRents/modules/nameSuburbs/script.R
- pipelines/aucklandRents/modules/rentalListings/script.R
- pipelines/aucklandRents/modules/suburbIDs/script.R
File number 1, pipelines/aucklandRents/modules/boxplotBySuburb/boxplot-rentBySuburb.svg, is the output file we require, the SVG image of the plot. The image is shown below:

Pipeline output: aucklandRents plot
Exporting the simpleGraph pipeline to XML
Our final step is to export the aucklandRents pipeline and its components to XML files so we can share them. The following code will create a directory with the same name as our pipeline, "aucklandRents", and create XML files for the pipeline and each of its components in this directory. This is done with the following code:
exportPipeline(pipeline = aucklandRents,
               targetDirectory = file.path(getwd(), "exportPipeline"))
The resulting pipeline file, exportPipeline/aucklandRents/pipeline.xml, contains the following XML:
## <?xml version="1.0"?>
## <pipeline xmlns="http://www.openapi.org/2014/">
##   <description></description>
##   <component name="rentalListings" ref="rentalListings.xml" type="module"/>
##   <component name="suburbIDs" ref="suburbIDs.xml" type="module"/>
##   <component name="nameSuburbs" ref="nameSuburbs.xml" type="module"/>
##   <component name="chooseSuburbs" ref="chooseSuburbs.xml" type="module"/>
##   <component name="boxplotBySuburb" ref="boxplotBySuburb.xml" type="module"/>
##   <pipe>
##     <start component="rentalListings" output="rentalListings.csv"/>
##     <end component="nameSuburbs" input="rentalListings.csv"/>
##   </pipe>
##   <pipe>
##     <start component="suburbIDs" output="suburbIDs.csv"/>
##     <end component="nameSuburbs" input="suburbIDs.csv"/>
##   </pipe>
##   <pipe>
##     <start component="nameSuburbs" output="namedListings"/>
##     <end component="chooseSuburbs" input="namedListings"/>
##   </pipe>
##   <pipe>
##     <start component="chooseSuburbs" output="shortListings"/>
##     <end component="boxplotBySuburb" input="listings"/>
##   </pipe>
## </pipeline>
The component XML files can be seen at:
- exportPipeline/aucklandRents/boxplotBySuburb.xml
- exportPipeline/aucklandRents/chooseSuburbs.xml
- exportPipeline/aucklandRents/nameSuburbs.xml
- exportPipeline/aucklandRents/rentalListings.xml
- exportPipeline/aucklandRents/suburbIDs.xml
Spotters will notice that the external output refs in rentalListings.xml and suburbIDs.xml refer to absolute paths on the author's machine; to run this pipeline these will need to be edited to reflect local locations of these data files. A mechanism for exporting data sources has not yet been written into conduit.
Example: combining R and python scripts
TODO: write an example combining R and python scripts

Guide to using conduit by Ashley Noel Hinton is licensed under a Creative Commons Attribution 4.0 International License.
References
Carey, Vince, Li Long, and R. Gentleman. RBGL: An Interface to the BOOST Graph Library. http://www.bioconductor.org.
Gentleman, R., Elizabeth Whalen, W. Huber, and S. Falcon. Graph: Graph: A Package to Handle Graph Data Structures.
Hansen, Kasper Daniel, Jeff Gentry, Li Long, Robert Gentleman, Seth Falcon, Florian Hahne, and Deepayan Sarkar. Rgraphviz: Provides Plotting Capabilities for R Graph Objects.
Hinton, Ashley Noel, and Paul Murrell. 2014. Conduit: Prototype Glue System for Openapi.
———. 2015. Introducing Openapi. 2015-01. Stat Tech: Statistics Technical Blog. Auckland, New Zealand: Department of Statistics, University of Auckland. http://stattech.wordpress.fos.auckland.ac.nz/.
Lang, Duncan Temple. 2013. XML: Tools for Parsing and Generating XML Within R and S-Plus. http://CRAN.R-project.org/package=XML.
———. 2014. RCurl: General Network (HTTP/FTP/.) Client Interface for R. http://CRAN.R-project.org/package=RCurl.
Murrell, Paul, and Ashley Noel Hinton. 2014. GridGraphviz: Drawing Graphs with Grid. http://R-Forge.R-project.org/projects/gridgraph/.
R Core Team. 2014. R: A Language and Environment for Statistical Computing. Vienna, Austria: R Foundation for Statistical Computing. http://www.R-project.org/.
Wickham, Hadley, and Winston Chang. 2014. Devtools: Tools to Make Developing R Code Easier. http://CRAN.R-project.org/package=devtools.