Govhack 2017: car crashes at the intersection of Karangahape and Newton Roads
Ashley Noel Hinton
30 July 2017
The day before Govhack 2017 started I was picking up my weekly comic book pulls from Heroes for Sale on K Road at about 6pm. We were talking, as you do, about crossing at the pedestrian crossing, looking out the door at the busy evening traffic. Someone mentioned that there were heaps of traffic accidents on the intersection of Karangahape and Newton Roads, and that trying to jay-walk there would be suicidal.
We live in the time of Google, so of course we tried looking online for information about how many crashes there were out Heroes for Sale’s front door, but we came up blank. That’s when I decided what my hack for the weekend would be: find out how many crashes happened outside my local comic book shop.
Data source
I used the disaggregated crash data from Waka Kotahi to try to answer this question. The data set has is available as as a 62MB CSV file, Disaggregated-crash-data.csv. An accompanying metadata file is also available, disaggregated-crash-data-metadata.csv.
These data record crashes attended by NZ Police in which someone was at least minorly injured. The data includes counts of injuries, nearest streets or other locations, and much more. There are 73 variables for each crash, which are detailed further in my data exploration document.
The location

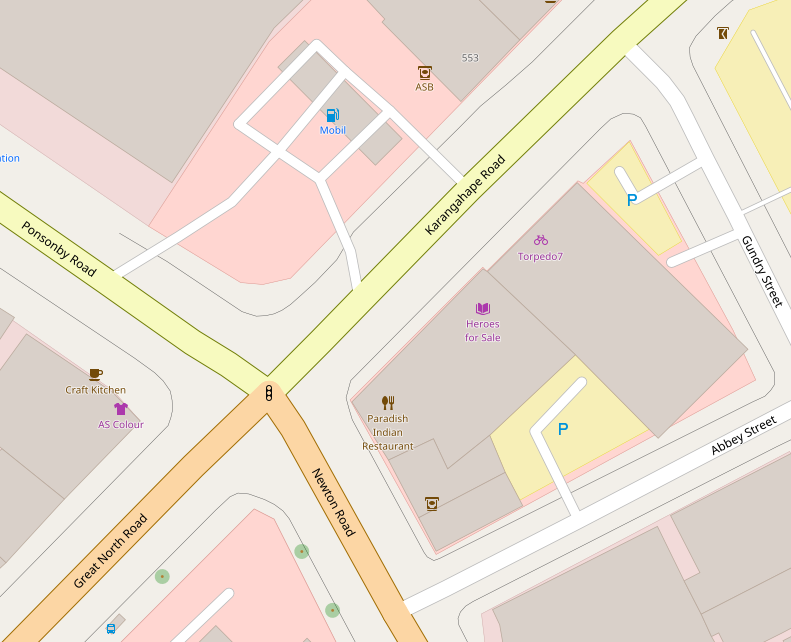
Map of the intersection of Karangahape and Newton Roads, Auckland © OpenStreetMap contributors
I’m interested in the intersection of Karangahape and Newton Roads in Newton, Auckland. For reasons detailed in my data exploration document there was no easy way to search for data by map co-ordinates, so instead I looked for crashes occurring at combinations of the following street names:
- Abbey St
- Great North Road
- Gundry St
- Karangahape Road
- Newton Road
- Ponsonby Road
How many crashes?
According to my exploration there were 51 crashes on our intersection between 2000 and 2016.
The following plot shows the number of crashes on this intersection by year:

Crashes by injury severity
0 crashes resulted in fatal injuries, 9 crashes resulted in serious injuries, and 43 crashes resulted in minor injuries.


Number of injuries
There have been 0 fatal injuries, 9 serious injuries, and 54 minor injuries, in these 51 crashes.

Crash location in detail
I thought it would be intereseting to look closer at where these crashes occurred. Here I have assumed that the variable crash_locn1 indicates the street on which the crash occurred, and crash_locn2 the nearest side street. With that in mind, the following plot shows the number of crashes by location:

Resources
Disaggregated crash data by Waka Kotahi is licensed under a Creative Commons Attribution 4.0 International License.
The map, images/intersectionMap.png is, © OpenStreetMap contributors.

Govhack 2017 by Ashley Noel Hinton is licensed under a Creative Commons Attribution 4.0 International License.